
Session mathematics
A 95% RTP describes millions of spins, not the one you're about to play
The Gambling Commission publishes the formula behind its own return-to-player checks. Run that formula for a session length people actually play, rather than the volumes the regulator monitors, and the number on the paytable stops looking precise.
What the percentage on the paytable is measuring
A slot's disclosed RTP is a single number standing in for two related but different figures. The Gambling Commission's own terminology distinguishes them plainly: theoretical RTP is "the designed return to player percentage of the game," the figure "advertised" and shown in the player-facing rules; actual RTP is "calculated using the generated win and turnover figures of the live (operational) game" and "shows the RTP the game has actually achieved for the past period." One is a design target set before the game ships. The other is a measured outcome, recalculated as real turnover and real wins accumulate.
The Commission's own consumer-facing guidance is unusually direct about what that design figure does and does not promise: "The %RTP is an average achieved over a significant number of game plays and not each time the gaming machine is played." Its worked example removes any ambiguity: "If a gaming machine displays an 85% RTP, you should not expect to win an average of 85 pence for every £1 you stake during a playing session." That sentence applies exactly the same way at 95%. The percentage on the paytable is a long-run design parameter, not a promise about the twenty or two hundred spins you are actually going to play tonight.
The regulator's own formula for how far actual can drift
Because actual RTP is measured, not designed, it will not sit exactly on the theoretical figure after any finite number of plays — and the Commission does not expect it to. Its guidance on live RTP performance monitoring sets operators a tolerance range around the theoretical figure, sized using "a 95% confidence interval," and states that this range narrows as more plays accumulate: "the tolerance will be wider when only a limited amount of play has been measured, but as the volume of play increases the tolerance will decrease." Crucially, the width of that range is not fixed across games. It depends on volatility, which the guidance defines as "most commonly the standard deviation of the game," and states that "the volatility of a game will detail the acceptable tolerance range and must be taken into account regardless of the amount of play accrued."
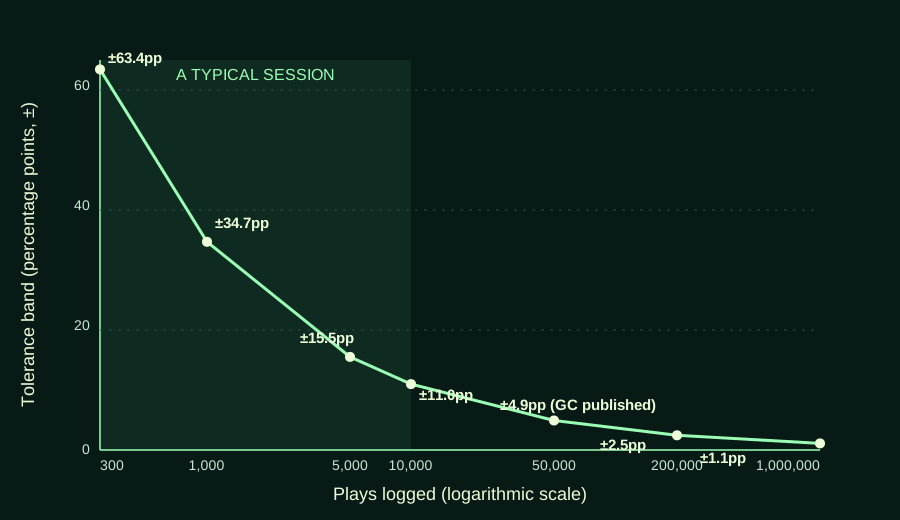
The Commission publishes one full worked table, for a game with a 91.68% theoretical RTP and a volatility (standard deviation) of 5.6. Its published tolerance narrows from roughly ±4.91 percentage points at 50,000 plays logged to roughly ±1.10 percentage points at 1,000,000 plays. Reproducing every value in that table from first principles shows the relationship is a standard statistical one: tolerance (± percentage points) = 1.96 × volatility ÷ √(plays logged) × 100. The 1.96 is the multiplier for a 95% confidence interval on a normal approximation; volatility here is the standard deviation of the gross return on one stake unit — the same kind of figure Reel & Story's own two-game worksheet computes for its toy examples (roughly £2.13 and £3.92 per £1 stake). Odds & Ends' explainer on expected value covers why any average needs a large number of independent trials before it becomes a reliable description at all; this page applies that idea specifically to a slot's disclosed RTP rather than re-deriving it.
Reproducing the Commission's published table
Before extending the formula anywhere the Commission hasn't, it is worth checking it reproduces what the Commission has actually published. The table below applies tolerance = 1.96 × 5.6 ÷ √N × 100 to the Commission's own 91.68% theoretical RTP example, at each play-count it publishes. The "our formula" column and the Commission's own published percentages match to two decimal places at every row.
| Plays logged | Commission's published tolerance | Our formula's result | Actual RTP range implied |
|---|---|---|---|
| 50,000 | ±4.91pp | ±4.91pp | 86.77%–96.59% |
| 100,000 | ±3.47pp | ±3.47pp | 88.21%–95.15% |
| 200,000 | ±2.45pp | ±2.45pp | 89.23%–94.13% |
| 300,000 | ±2.00pp | ±2.00pp | 89.68%–93.68% |
| 400,000 | ±1.74pp | ±1.74pp | 89.94%–93.42% |
| 500,000 | ±1.55pp | ±1.55pp | 90.13%–93.23% |
| 1,000,000 | ±1.10pp | ±1.10pp | 90.58%–92.78% |
Source: Gambling Commission, live RTP performance monitoring of games of chance, published tolerance values; range column is our own arithmetic applying the stated theoretical RTP.
Running the same formula for a session, not a monitoring window
The Commission's table starts at 50,000 plays because that is the volume at which its monitoring becomes useful; below it, the guidance says a "small amount of play will be pointless as the tolerance will be too large for meaningful results." That line is doing real work: it is an admission that the same formula, run for smaller N, produces a tolerance too wide to be a meaningful check on fairness. It does not stop being true, though — it stops being useful for detecting a fault. For understanding what the average means to a person playing a session rather than a lab monitoring a live game, that same "too large" number is exactly the point.
The table below extends the identical formula — same 91.68% theoretical RTP, same volatility of 5.6 — down to volumes closer to a real leisure session: a few hundred spins, not a few hundred thousand. Treat this extension as illustrative, not as a regulator-validated figure; the normal approximation the Commission relies on is least reliable exactly where session lengths sit, which is itself part of the honest answer to "what does 95% mean for my session" — the number was never built to describe it precisely.
| Plays in the session | Tolerance band (±) | Implied actual-RTP range |
|---|---|---|
| 300 | ±63.4pp | 28.3%–100%+ (band exceeds the mean) |
| 1,000 | ±34.7pp | 57.0%–126.4% |
| 2,000 | ±24.6pp | 67.1%–116.3% |
| 5,000 | ±15.5pp | 76.2%–107.2% |
| 10,000 | ±11.0pp | 80.7%–102.7% |
Two things about that table matter more than any single row. First, the band does not merely widen a little at session length — it dwarfs the 91.68% figure itself, at 300 plays exceeding it in one direction. Second, this is not a claim that a session can genuinely return "126%" or that negative returns are somehow impossible; a real distribution of prizes is bounded below at zero and has none of the tidy symmetry a normal approximation assumes at this range. What the table demonstrates honestly is narrower and more useful: the same statistical reasoning the regulator itself relies on, applied honestly to a session instead of a monitoring window, shows the theoretical percentage carrying far less session-level information than a single clean number suggests.
Put your own numbers through the same formula
The calculator below runs exactly the formula reproduced above — tolerance = 1.96 × volatility ÷ √(plays) × 100 — against whatever RTP, volatility and session length you enter. It performs arithmetic only. It does not simulate an actual game, connect to any operator, or predict an outcome; treat the output the same way the tables above should be treated at low play counts — as a demonstration of how wide the theoretical range around an average genuinely is, not a forecast for a specific session.
Volatility is the other half of the sentence
"Is 95% a good RTP" is an incomplete question, and the Commission's own material suggests why: "there is no minimum RTP on a gaming machine," so there is no regulatory floor to compare against. What varies the meaning of a given percentage far more than a point or two either way is volatility, which the Commission describes qualitatively as well as numerically: "A highly volatile game will have a larger tolerance and might be comprised of prizes falling into the 'very large but rare' category. A low volatility game will be much more predictable and mostly comprised of prizes falling into the 'small and often' category."
Reel & Story's own worksheet demonstrates the same idea with two fully specified toy games that share a 95% RTP: one paying small prizes often (standard deviation of roughly £2.13 on a £1 stake), the other paying rarely but larger (standard deviation of roughly £3.92). Put both through this page's formula and the higher-volatility game's actual-RTP tolerance band is nearly twice as wide at any given play count, purely because volatility sits in the numerator of the same equation. Two games can carry an identical headline percentage and a very different answer to "how far might this session's result sit from that number" — and volatility, where an operator discloses it, is what answers that second question, not the RTP figure alone.
Why "does RTP change between casinos" is the wrong question
Theoretical RTP is fixed for a specific version of a specific game — it is a design figure, not a live measurement, so it cannot drift between one site and another for the same build of the same title. What can genuinely differ is actual RTP, because it is calculated from real turnover and real wins over a real period, and two operators running the same game will not have logged identical play. The Commission's monitoring guidance also flags a more specific source of difference: where a game exists across more than one technical channel, "a game fault might only exist in one channel," which "will be harder to detect if activity from all channels is aggregated into one measurement" — a reason the guidance points toward checking performance per channel rather than assuming one blended figure describes every version equally.
What we could not confirm from the Commission's own published guidance, and have therefore left out rather than asserted, is whether individual operators can select from multiple pre-configured theoretical-RTP versions of the same slot title as a matter of routine. Some third-party commentary claims this happens; it is not something today's primary sources establish, so it appears in this page's unverified list rather than in the body text as fact.
A method for reading the number before you play
Take three questions back to any RTP figure before treating it as informative. First, which figure is this: a theoretical, designed percentage, or an actual, measured one covering a stated period? The Commission's own rules on game descriptions require that customers be given enough information to make an informed decision before committing, through a description of "the way the game works and the way in which winners are determined" alongside either the RTP, the house edge, or a stated probability — but the standard does not require operators to label every figure as theoretical or actual, so that distinction is often something you have to work out from context.
Second, over what volume was it measured, or is it disclosed as a design target regardless of volume? A percentage attached to "over the last 30 days" behaves completely differently from one printed on a static rules page. Third, is a volatility or variance figure disclosed alongside it? If it is, that number — not the RTP — is what tells you whether a session is more likely to look like frequent small returns or a long, quiet run interrupted rarely. If it is not disclosed, treat the RTP as one part of a larger, partly hidden picture rather than a complete description of what a session can do. None of this method predicts a result. It only stops one honest number from being read as a promise it never made.
Game documentation
- Gambling Commission — RTS 3: rules, game descriptions and the likelihood of winning (accessed 19 September 2026)
- Gambling Commission — RTS 7: generation of random outcomes (accessed 19 September 2026)
- Gambling Commission — How to calculate return to player (RTP) (accessed 19 September 2026)
- Gambling Commission — Live return to player performance monitoring of games of chance (accessed 19 September 2026)
- Gambling Commission — Key terms relating to live RTP performance monitoring (accessed 19 September 2026)
- Gambling Commission — Other considerations for live RTP performance monitoring (accessed 19 September 2026)
- Gambling Commission — Return to player: how much do gaming machines pay out? (accessed 19 September 2026)